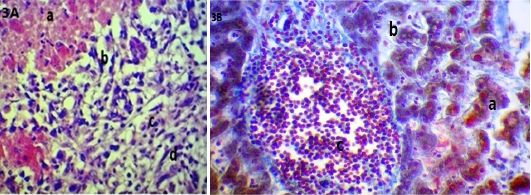
Figure 3
A: Photomicrograph of the liver in 3rd group showed: (a) acute cellular swelling, (b) increase width of sinusoid, (c) infiltration of mononuclear cells, (d) newly bile duct (H and E stain; X40). B: Photomicrograph of the liver in 3rd group showed: (a) acute cellular swelling, (b) width sinusoid, (c) mononuclear cells infiltration and eosinophil (Masson trichrome stain; X40).
