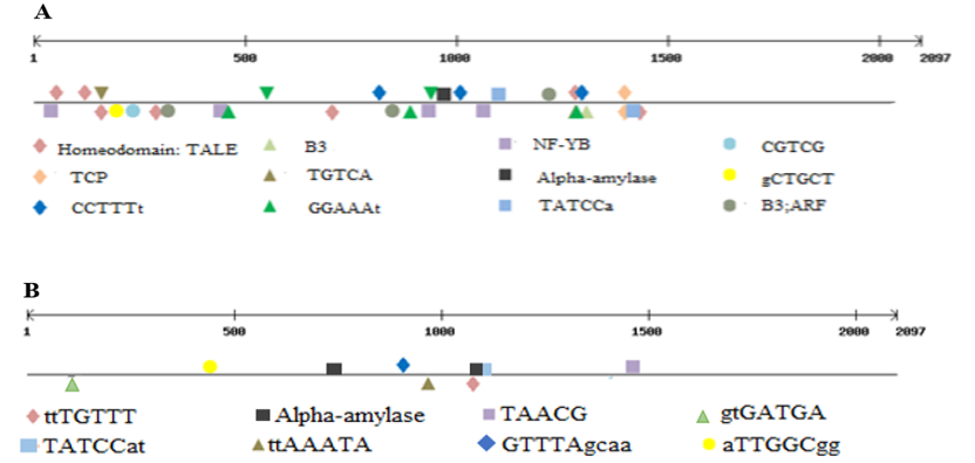
Figure 4:
A, B: Representative map showing distribution and localization of selected transcription factor binding sites within 1.5 Kb OsGLP12-3 promoter region from Nipponbare.
Legend: Upper region of line represents Plus Strand; Lower region of line represents Minus strand.