
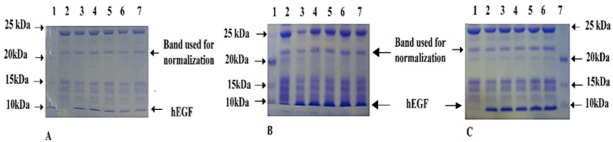
Fig. 1.
Expression analysis of hEGF on 15% polyacrylamide gel. A, Expression of hEGF for single copy construct. Lane 1, PAGE Ruler TM unstained protein ladder. Lane 2, Un-induced sample. Lanes 3 to 7 show induced samples having bands of hEGF slightly below than 10kDa are clearly visible. B, Expression of hEGF for double copy construct. Lane 1, PAGE Ruler TM unstained protein ladder. Lane 2: Un-induced sample. Lanes 3 to 7: Induced samples. Bands of hEGF with much bright intensity are clearly visible. C, Expression of hEGF for triple copy construct. Lane 7: PAGE Ruler TM unstained protein ladder. Lane1, Un-induced sample. Lane 2 to 6, Induced samples. Bands of hEGF are visible. Intensity of bands were analyzed by densitometric analysis.