
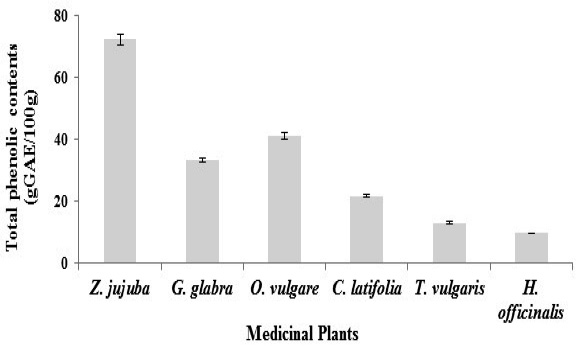
Figure 1:
Determination of total phenolic contents (mg GAE/g dry wt.) in six medicinal plants in vitro. Data represent mean ± SD, using one way analysis of variance (one way ANOVA), data was statistically analyzed. Differences in means were sorted out using Duncans Multiple Range (DMR) test with the help of SAS 9.1 for windows. The P< 0.05 was considered statistically significant.