View larger version:
Download Original File
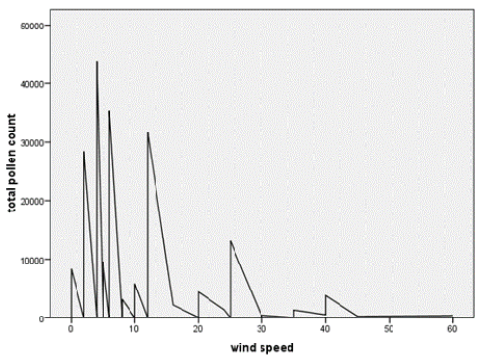
Figure 4:
Graphical representation of total pollen count of 2009 and wind speed correlation.