
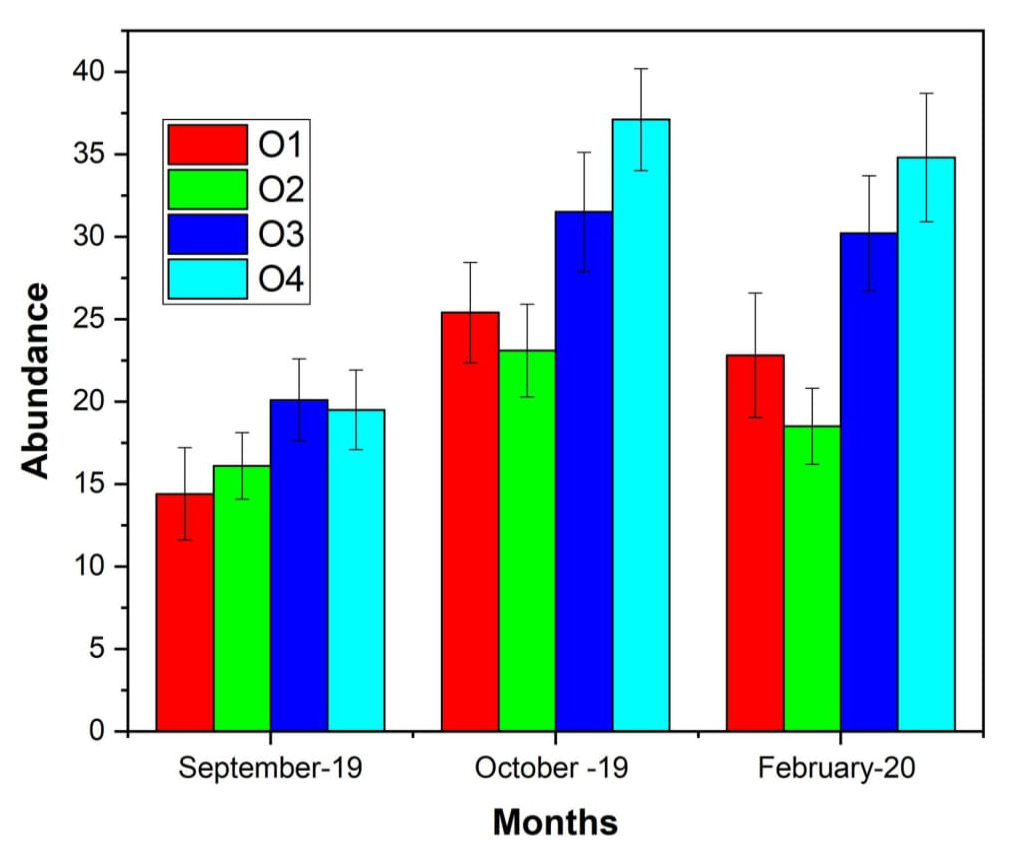
Figure 5:
Abundance of mite families in different orchards with respect to months. The error bars represent standard errors of mean values.
Abundance of mite families in different orchards with respect to months. The error bars represent standard errors of mean values.