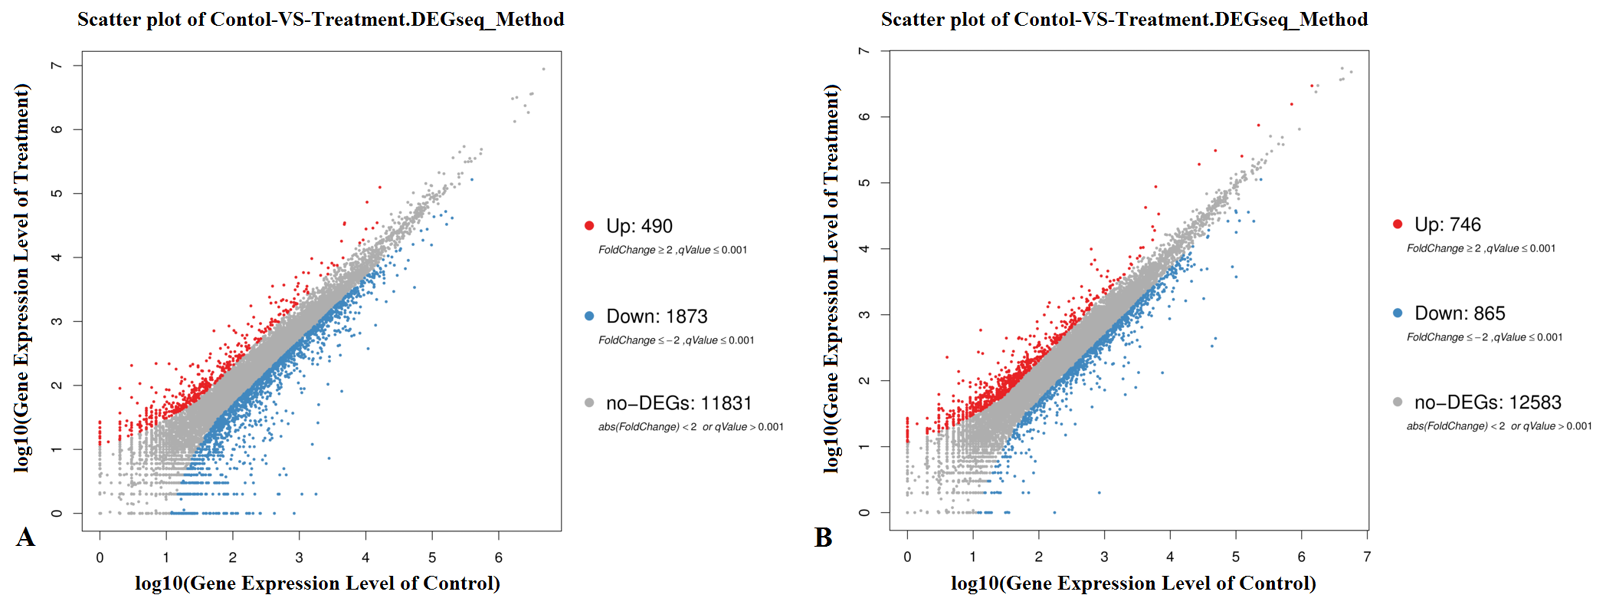
Fig. 1.
Scatter plot of differentially expressed genes. (A) Lan5; (B) Mysore. X and Y axis represents log10 transformed gene expression level, red color represents the up-regulated genes, blue color represents the down-regulated genes, gray color represents the non-DEGs.