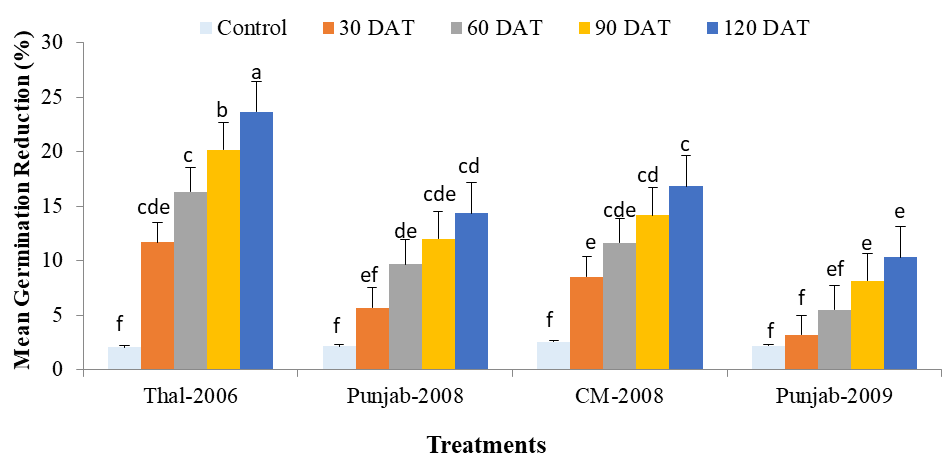
Figure 3:
Mean germination reduction (%) of grains of different chickpea varieties incurred by the infestation of C. chinensis recorded at different days after treatment (DAT). Different letters at top of treatment columns indicate significant difference among them (LSD test at α = 0.05). Columns represent mean percent mortality ± SE (n = 5) (see Table 3).