
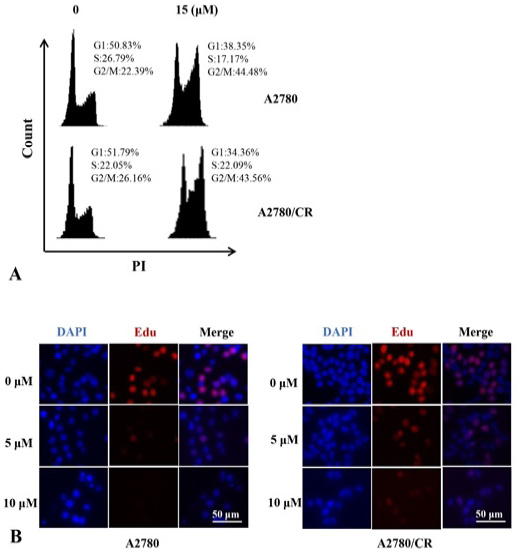
Fig. 2.
Effect of ALT on cell cycle progression and proliferation. (A) A2780 and A2780/CR cells were cultured in the presence or absence of ALT for 24 h. The cells were harvested and incubated with RNase A and PI. The cells were analyzed for cell cycle profile using flow cytometer. (B) Cells proliferation rates were analyzed by Edu cell proliferation assay. Blue cells stained with DAPI (left) indicate total number of cells, Red cells (middle) labelled with Edu are proliferating cells. In merge cell population, pink cells are proliferating cells.