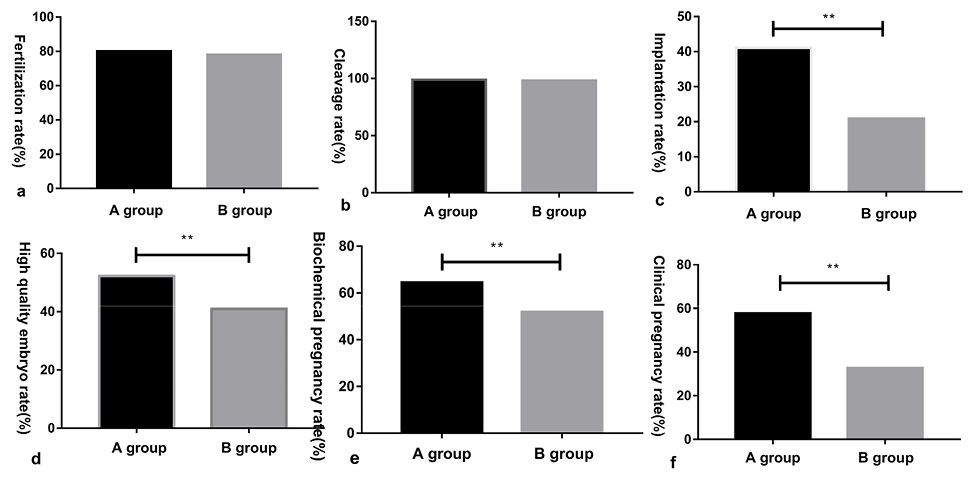
Fig. 3.
Comparison of pregnancy outcomes of patients between the two groups. a is Fertilization rate; b is Cleavage rate; c is Implantation rate; d is High quality embryo rate; e is Biochemical pregnancy rate; f is Clinical pregnancy rate; ** means P<0.001.