View larger version:
Download Original File
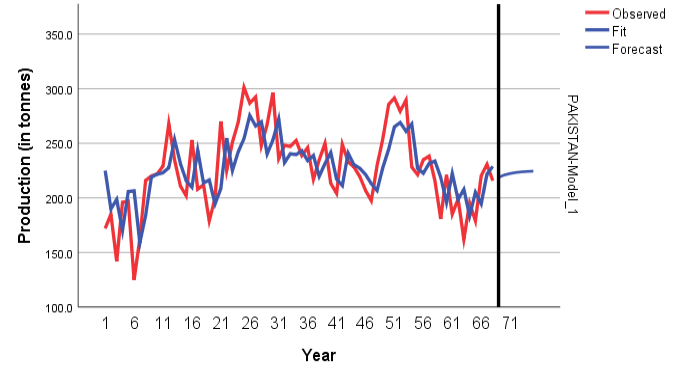
Figure 5:
Plot of observed, fitted, and forecasted values.