
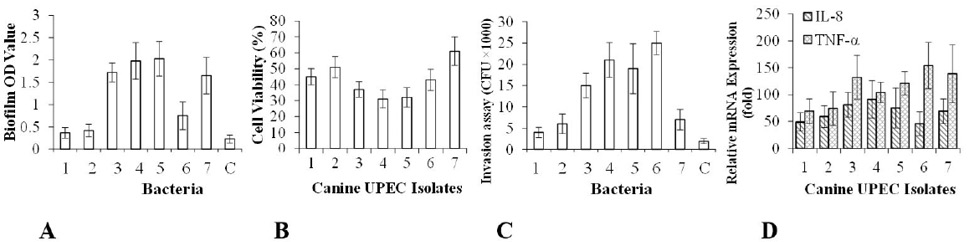
Fig. 1.
A, Biofilm formation observed at OD600; B, cytotoxicity assay WST-1 Kit; C, invasion assay the survival CFU of recovered T24 cells, Y-axes indicate averaged CFU values recovered; D, transcriptional levels of il-8 and tnf-α. All data were normalized to the housekeeping gene gapdh, values indicated the changed folds of expression level of genes; values are means of the results of 3 independent experiments; error bars indicate standard deviations; No. 1-7: 7 canine UPEC strains; C: DH5α.