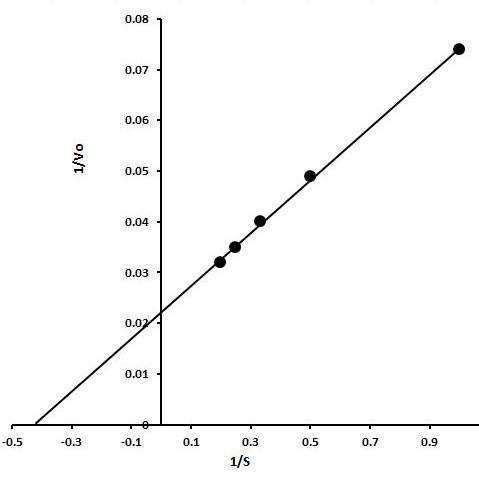
Fig. 6.
Lineweaver-Burk plot for the estimation of kinetic parameters. X-axis shows 1/substrate concentration whereas Y-axis shows 1/enzyme velocity.
Lineweaver-Burk plot for the estimation of kinetic parameters. X-axis shows 1/substrate concentration whereas Y-axis shows 1/enzyme velocity.