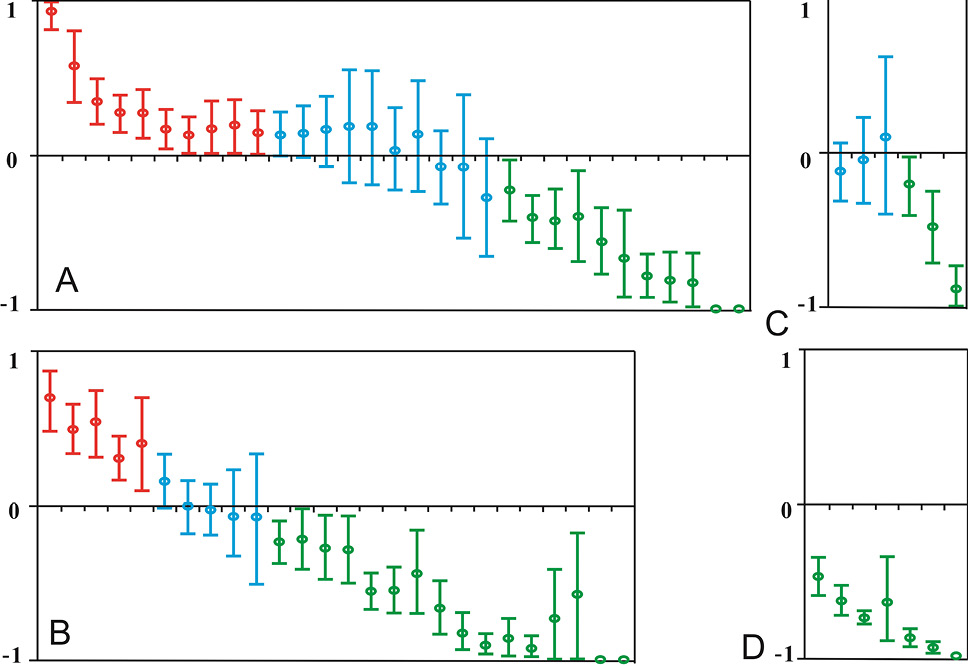
Fig. 1.
Bootstrap descriptive statistics for the derived Ei values (a measure of dietary preference for the food) for each plant species, with associated 90% confidence intervals (red: positively selected; blue: not definitely preferred; green: negatively selected). A, B, C and D are sweet plants, bitter plants, other-taste plants and tasteless plants, respectively. The scientific names and detailed descriptive statistics of each of the sampled plants are seperately shown in Supplementary Table S1.