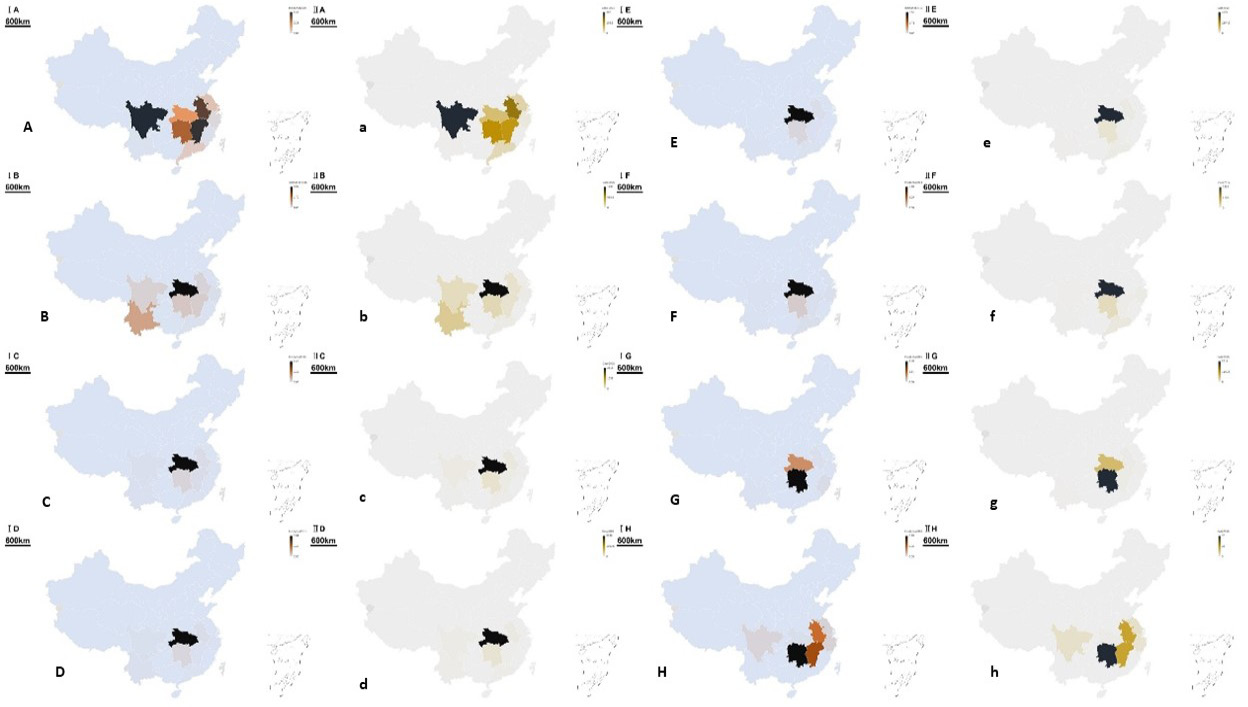
Fig. 3.
Maps of schistosomiasis cases and incidence in mainland China, 2004-2018.
Figure shows maps with incidence of schistosomiasis in 2004 (A), 2006 (B), 2008 (C), 2010 (D), 2012 (E), 2014 (F), 2016 (G), and 2018 (H). The figure also shows schistosomiasis cases in 2004 (a), 2006 (b), 2008 (c), 2010 (d), 2012 (e), 2014 (f), 2016 (g), and 2018 (h).