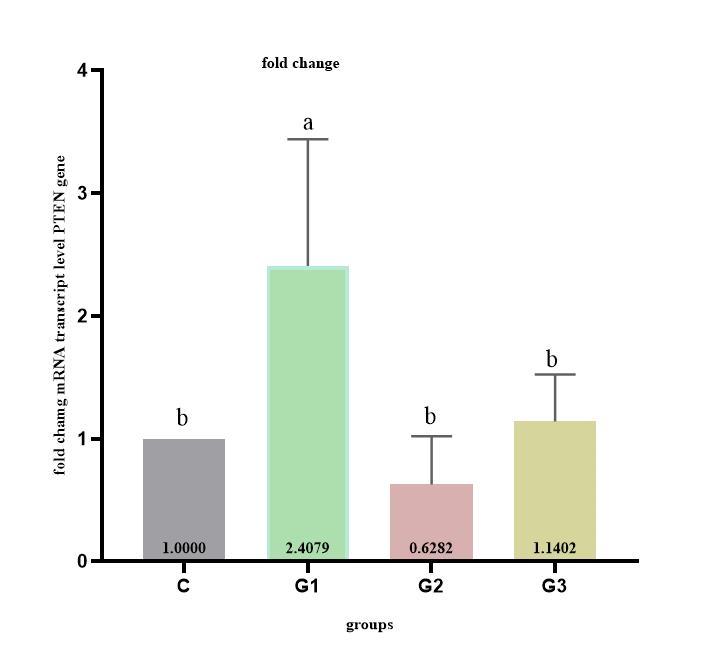
Figure 6
Assessment of PTEN gene expression in ovarian tissues of rats treated with CurSeNPs, doxorubicin and both after 14 days.
Values are expressed as mean ± SD, n=5. C= Control group. G1 = Injected with i/p doxorubicin 4.40 mg /kg. B.W. G2 = Administrated with CurSeNPs 10.47 μg / kg B.W orally. G3 = Administrated with CurSeNPs 10.47 μg / kg B.W orally and with doxorubicin 4.40 mg/ kg B.W i/p. Different small letters present on bars indicate significant differences between groups at P<0.05.