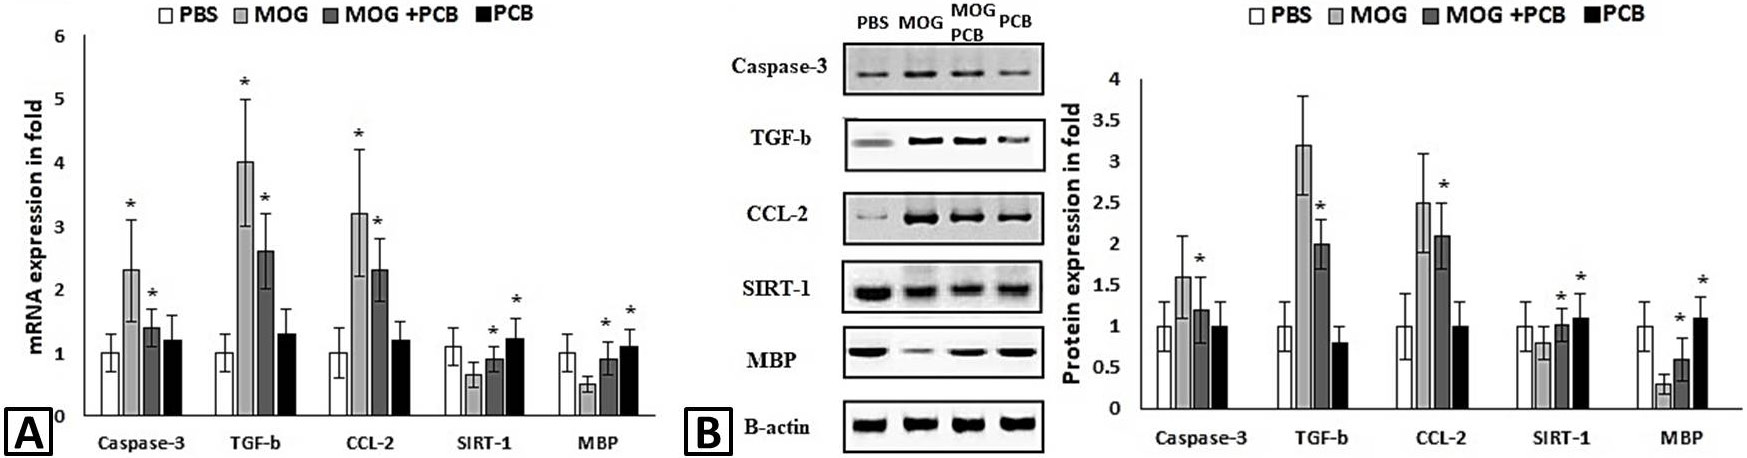
Fig. 5.
Expression level of caspase-3 TGF-β, CCL-2, SIRT-1, MBP mRNA and protein in vivo. A, mRNA of caspase-3, TGF-β, CCL-2 were downregulated in mouse model after PCB treatment. Whereas, SIRT1 and MBP were upregulated in PCB group compared with untreated EAE group; B, protein expression was observed similar like mRNA expression. GAPDH used as internal control for mRNA. Beta actin used as internal control for protein. For each group values were presented as mean ± SD. One way ANOVA followed by post hoc t-test were used for statistical analysis (significant at p. ≤ 0.05).