View larger version:
Download Original File
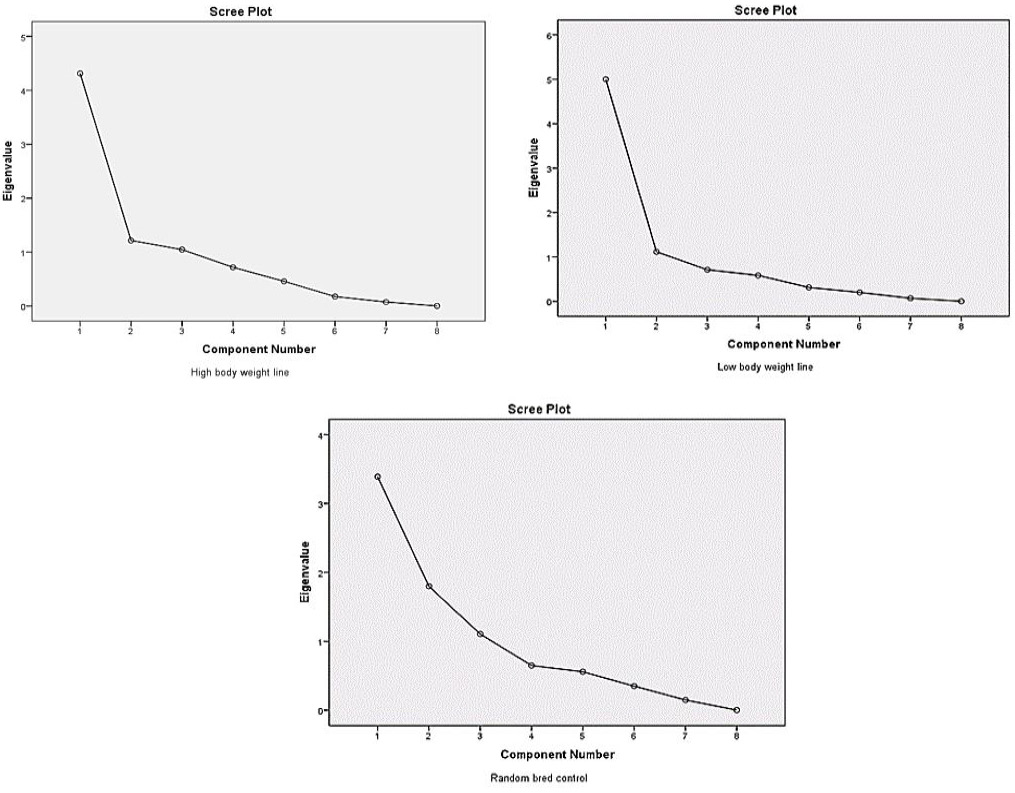
Figure 1:
Scree plot of the eigenvalues against the number of extracted components for the three lines.