
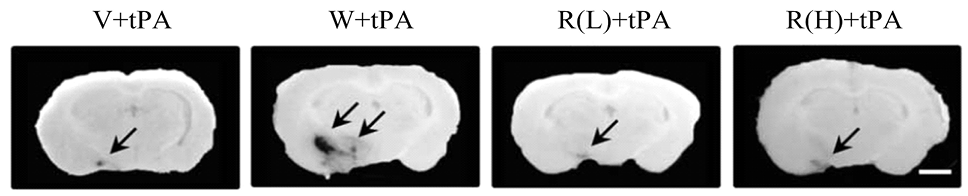
Fig. 1.
Representative photographs of intracerebral hemorrhage (ICH) show: W+tPA group has stronger intracerebral hemorrhage (arrow), R(L)+tPA group has weaker intracerebral hemorrhage, (R(H)+tPA group has stronger intracerebral hemorrhage (arrow), R(L)+tPA has weaker intracerebral hemorrhage, (R)+tPA group has stronger intracerebral hemorrhage (arrow), and R(H)+tPA group has weaker intracerebral hemorrhage (arrow). Scale: 2mm.
For details of groups, see Table I.