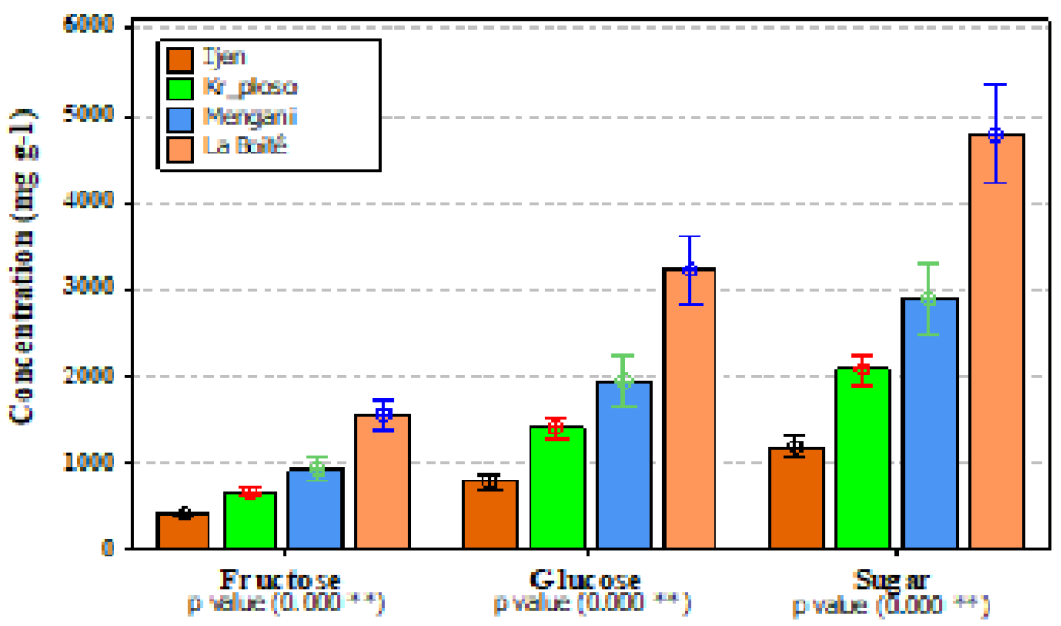
Figure 3:
Dietary fiber content expressed as a heatmap (Fig. 3a), and sugar contents indicated in the bar graph (Fig. 3b). The value expressed in the heatmap is z standardized.
Dietary fiber content expressed as a heatmap (Fig. 3a), and sugar contents indicated in the bar graph (Fig. 3b). The value expressed in the heatmap is z standardized.