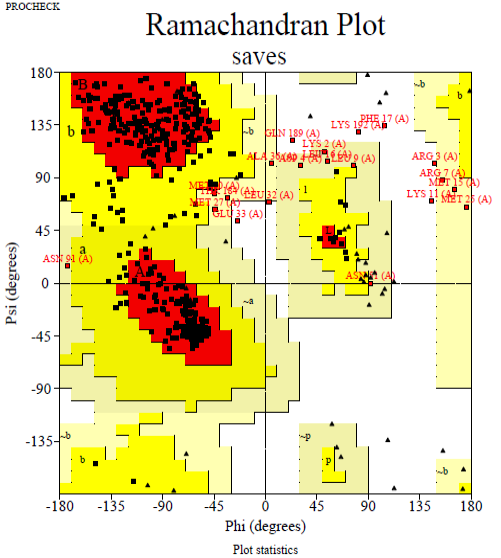
Fig. 9.
The Ramachandran plot of predicted chitinase indicating total residues in the the most favored areas (red region) and additional additional permitted areas regions (yellow region) are 82.9 and 12.3%, respectively.
The Ramachandran plot of predicted chitinase indicating total residues in the the most favored areas (red region) and additional additional permitted areas regions (yellow region) are 82.9 and 12.3%, respectively.