
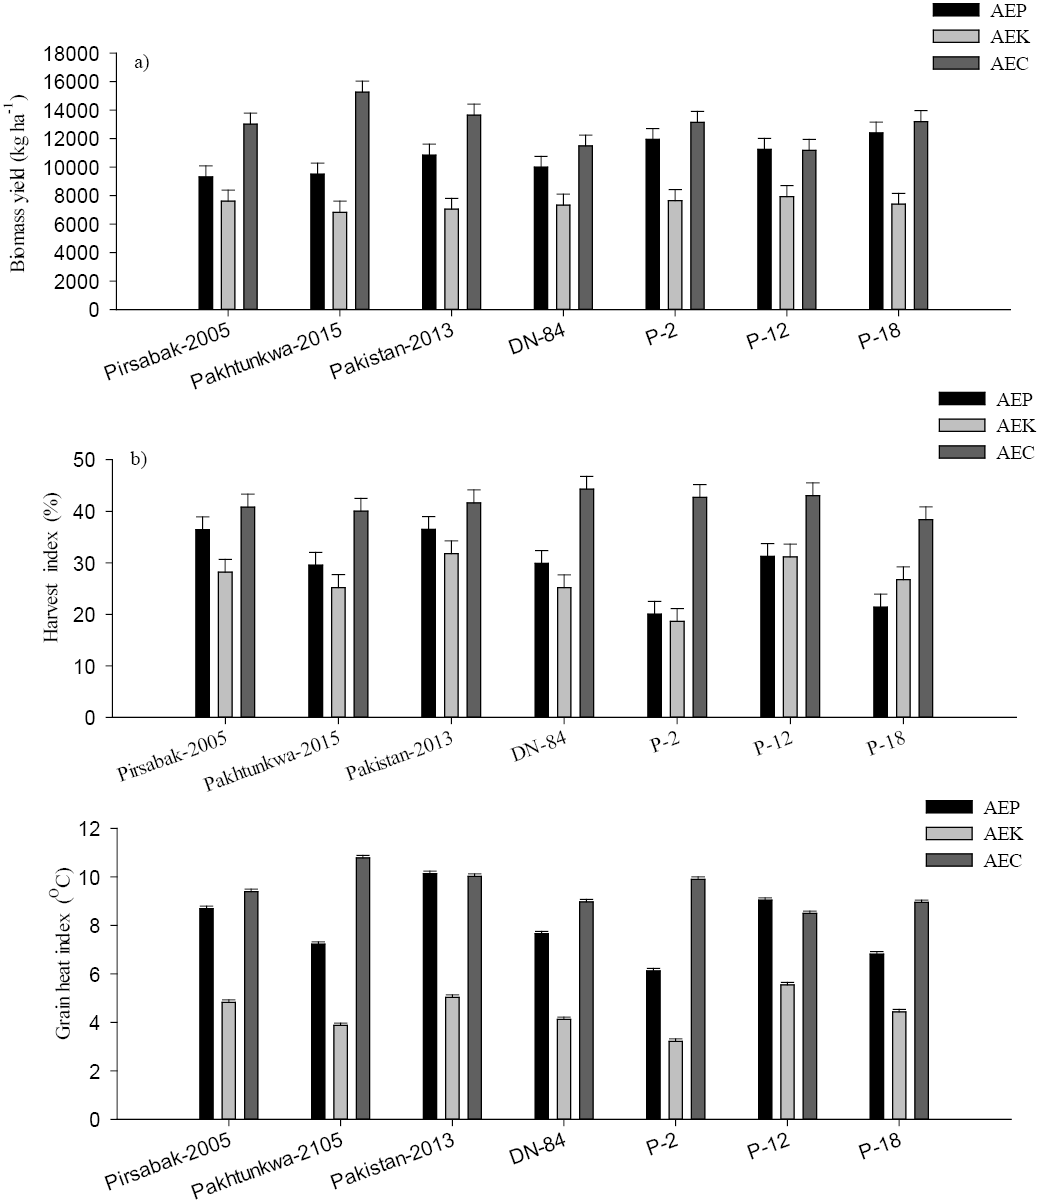
Figure 4:
Treatment interaction (genotypes x AE) in different windows (a) biological yield (kg ha-1),(b) harvest index (%) and (c) grain heat index (oC) of wheat genotypes. LSD of means is shown in vertical bars.
Treatment interaction (genotypes x AE) in different windows (a) biological yield (kg ha-1),(b) harvest index (%) and (c) grain heat index (oC) of wheat genotypes. LSD of means is shown in vertical bars.