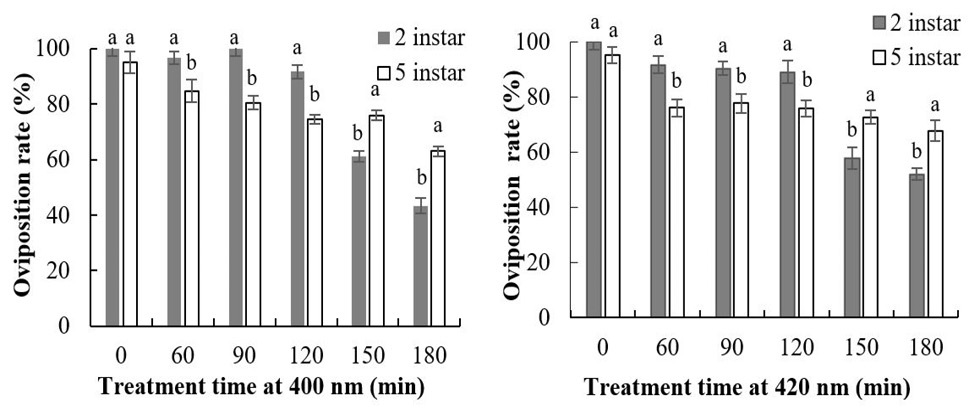
Fig. 1.
Effects of different wavelengths and different treatment time on the oviposition rate.
Different letters indicate the significant difference at the level of 0.05 at the same treatment time on 2 and 5 instars. The values are Mean ± SEM.