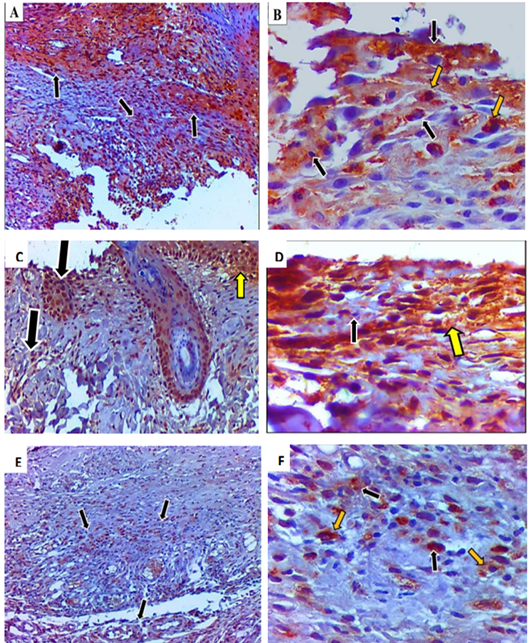
Photomicrograph in AandB: G1 (control positive group): Overexpression of TNF-α in fibroblasts (black arrow) and macrophages (yellow arrow) in dermis layer of affected area. Note, massive expression of TNF-αcovered more than 75% of tissue area. Also, the affected dermis layer showed deposition of collagen fibers due to chronic inflammation. C and D: (G2) Weak of TNF-αin fibroblasts (black arrow) and macrophages (yellow arrow) in dermis layer of affected area. Note, expression of TNF-α covered less than 20% of tissue area. EandF: (G3) Moderate expression of TNF-α in fibroblasts (black arrow) and macrophages (yellow arrow) in dermis layer of affected area. Note, expression of TNF-α covered more than 30% of tissue area. DAB and Hematoxylin. A,C,E: 100x and B, D, F: 400x.