View larger version:
Download Original File
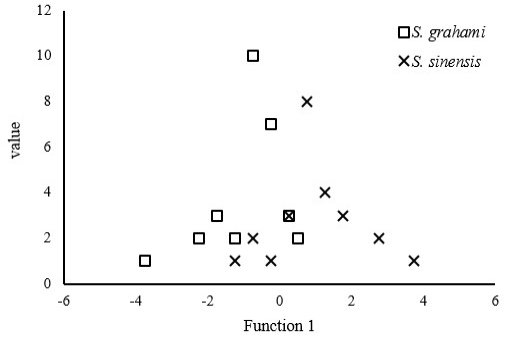
Fig. 3.
Scatter plot of scores based on the first one canonical discriminant functions.