
Fig. 3.
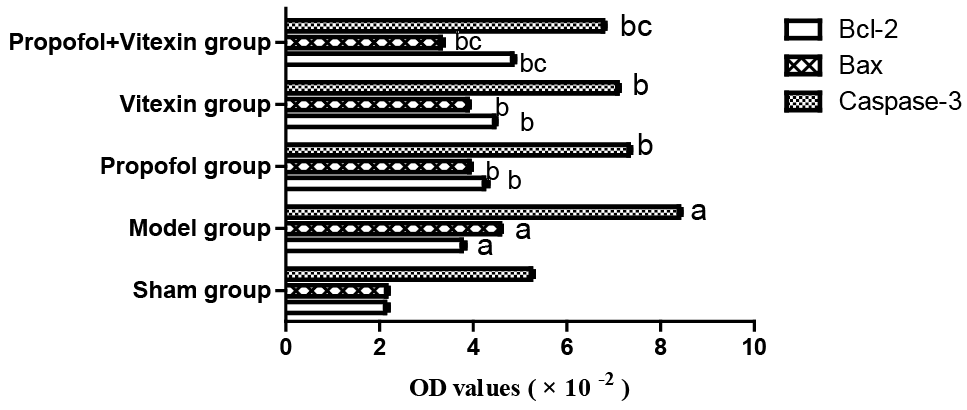
Effect of propofol and vitexin on Bcl-2, Bax and caspase-3 proteins expression level in liver tissue 6 h after reperfusion (n=10). aP<0.05 vs sham group; bP<0.05 vs model group; cP<0.05 vs propofol group and vitexin group.
Effect of propofol and vitexin on Bcl-2, Bax and caspase-3 proteins expression level in liver tissue 6 h after reperfusion (n=10). aP<0.05 vs sham group; bP<0.05 vs model group; cP<0.05 vs propofol group and vitexin group.