Fig. 6.
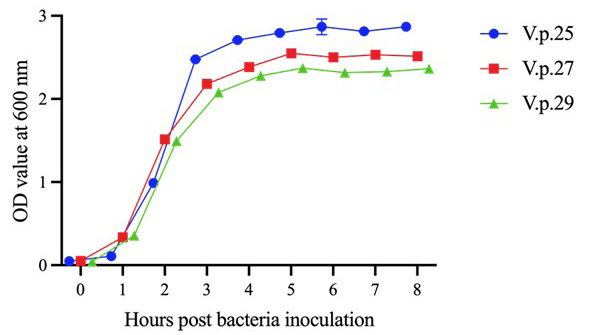
Growth curves of V.p.25, V.p.27, and V.p.29. The three strains of V. parahaemolyticus reached the growth plateau at 4 h after inoculation. Error bars represent SD of three independent detected OD600 values of one sample.
Growth curves of V.p.25, V.p.27, and V.p.29. The three strains of V. parahaemolyticus reached the growth plateau at 4 h after inoculation. Error bars represent SD of three independent detected OD600 values of one sample.