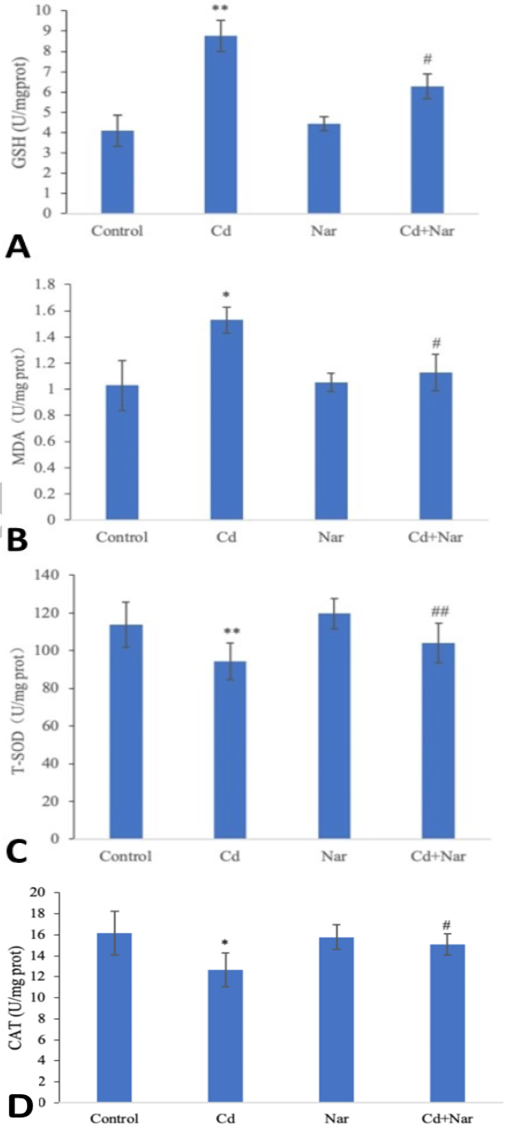
Fig. 2.
Effect of naringenin on GSH (A), MDA (B), and T-SOD activity (C) in rat kidney. Rats were treated with Cd an/or Nar for 4 weeks. Then, the content of GSH and activities of catalase and SOD in kidney tissue of rats in different treatment groups were detected. Data are represented as mean ± SE. n=6. “*” or “**” means that the difference is significant (* P<0.05) or extremely significant (** P<0.01) compared with the control group; “#” or “##” means that the difference is significant (# P<0.05) or extremely significant (## P<0.01) compared with the Cd-treated group.
