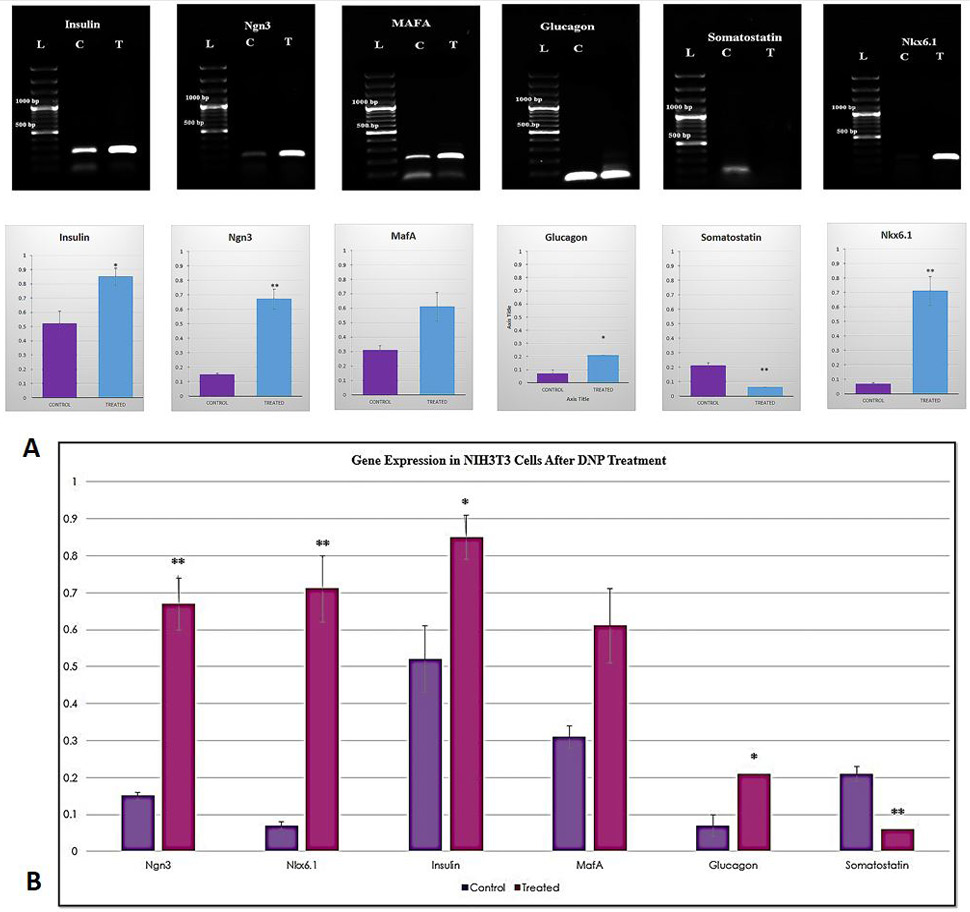
RT-PCR analysis of pancreatic genes in NIH3T3 cells after DNP treatment. Expression levels of insulin, Ngn3, MafA, Nkx6.1 and somatostatin in NIH3T3 cells before and after DNP treatment. Graphical representation is also shown. Ngn3, Nkx 6.1, insulin, and glucagon expression was significantly increased (p < 0.01, p < 0.01, p < 0.05 and p < 0.05, respectively) while that of somatostatin was significantly decreased (p<0.001) after DNP treatment. No significant change was observed in MafA expression after DNP treatment (Fig. 2A). Combined graphical representation of pancreatic gene expression in untreated and DNP treated groups is also shown (Fig. 2B). Data is presented as mean ± S.E.M; level of significance is p < 0.05; (where *** = p < 0.001, ** = p < 0.01, and * = p < 0.05.