
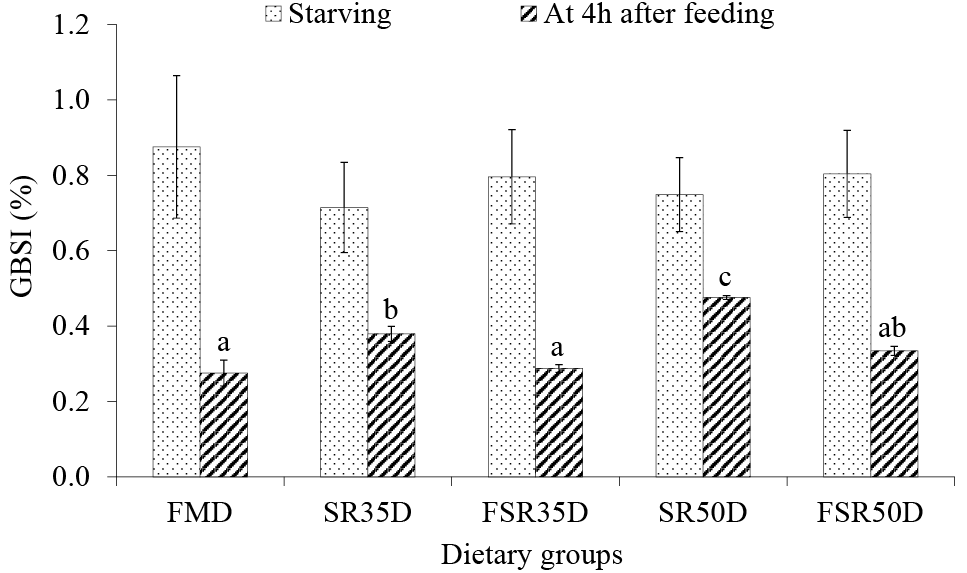
Fig. 1.
GBSI of red tilapia fed the experimental diets. Values are presented as means and standard deviations (starving, n = 15; at 4h after feeding, n = 18). Bars assigned with different letters within each sampling time denote significant differences (P < 0.05).
For details of groups, see Table II.