
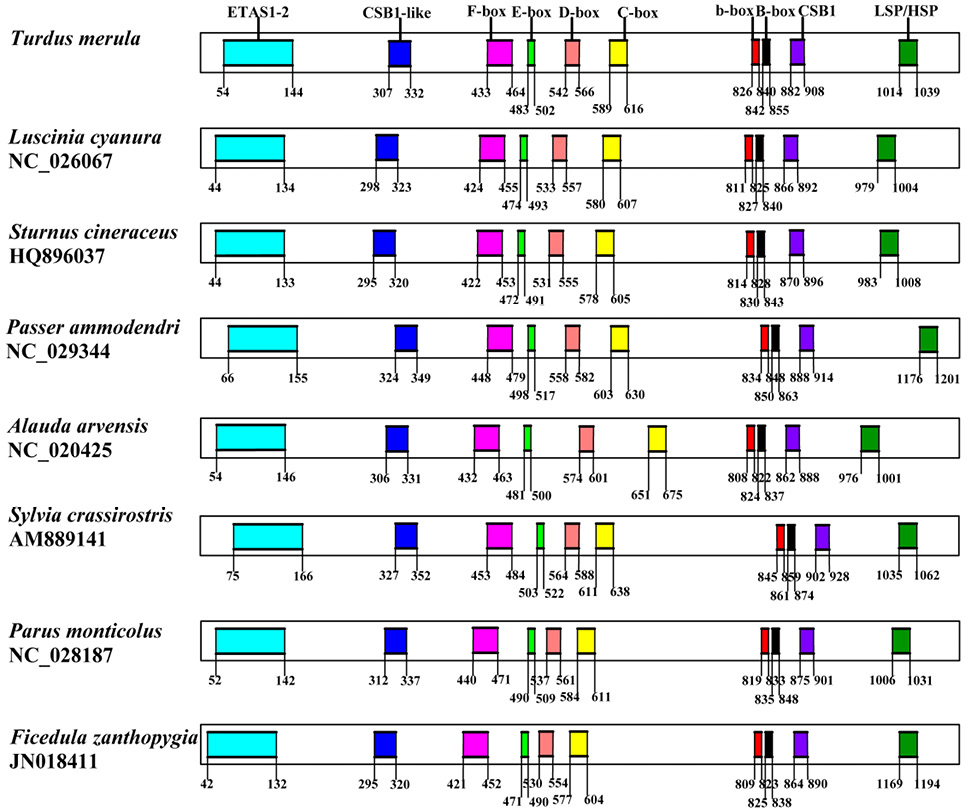
Fig. 7.
The structure of the control region of T. merula in this study. The number in rectangle frames denotes the numerical value of the boundary. Sequential features are indicated above the graph.
The structure of the control region of T. merula in this study. The number in rectangle frames denotes the numerical value of the boundary. Sequential features are indicated above the graph.