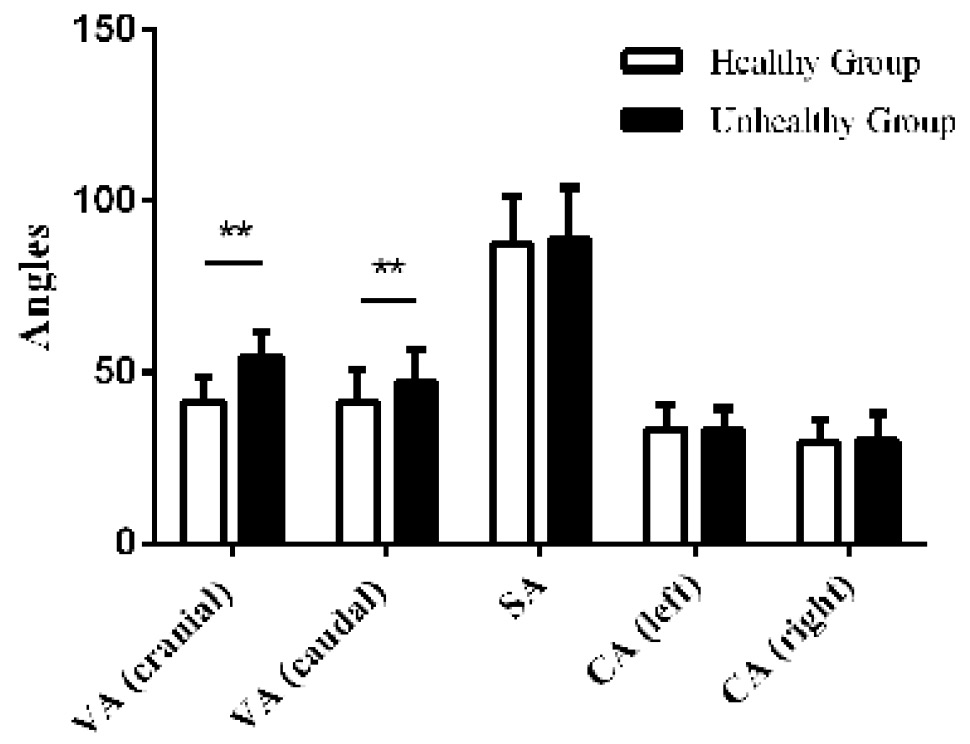
Fig. 4.
Variance analysis of PLFA in healthy group and unhealthy group. The bar with (**) indicates a significant difference (p<0.01) between the healthy group and the unhealthy group.
Variance analysis of PLFA in healthy group and unhealthy group. The bar with (**) indicates a significant difference (p<0.01) between the healthy group and the unhealthy group.