Figure 1:
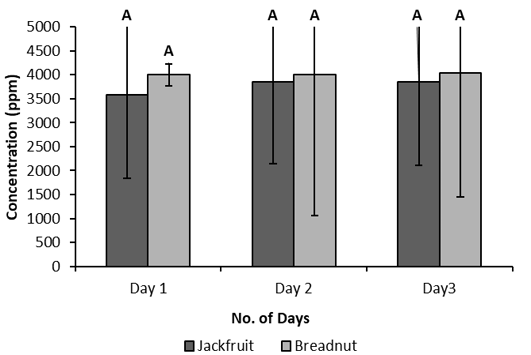
LC50 of Artocarpus heterophyllus and Artocarpus camansi from day 1 to day 3. The darker bar indicates the mean concentration of LC50 for the A. heterophyllus and the lighter bar for A. camansi with their standard error mean. The same letters above the bars denotes no statistical significant difference (P>0.860) between the two by one-way ANOVA with Tukey-Kramer HSD multiple comparisons.