
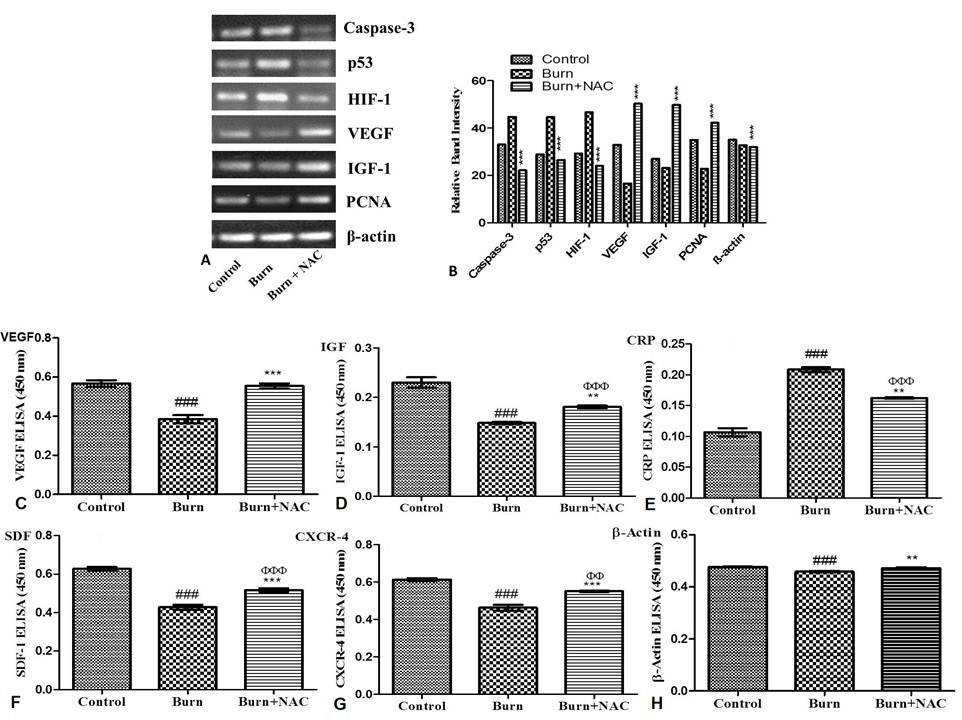
Fig. 4.
Effect of NAC on gene-expression analysis of rats inflicted with burn injury. Gene expression of skin preconditioned with NAC groups compared with control and Burn group along with corresponding quantification. Error bars represent ± standard error of mean (SEM). Control versus burn group, #P < 0.05; ##P < 0.01; and ###P < 0.001; Control versus Burn+NAC group, ΦP < 0.05; ΦΦP < 0.01; and ΦΦΦP < 0.001; Burn versus Burn+NAC group, *P < 0.05; **P < 0.01; and ***P < 0.001.