View larger version:
Download Original File
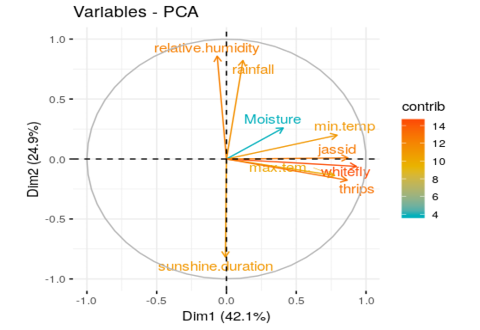
Figure 13:
PCA Figure for environmental variation