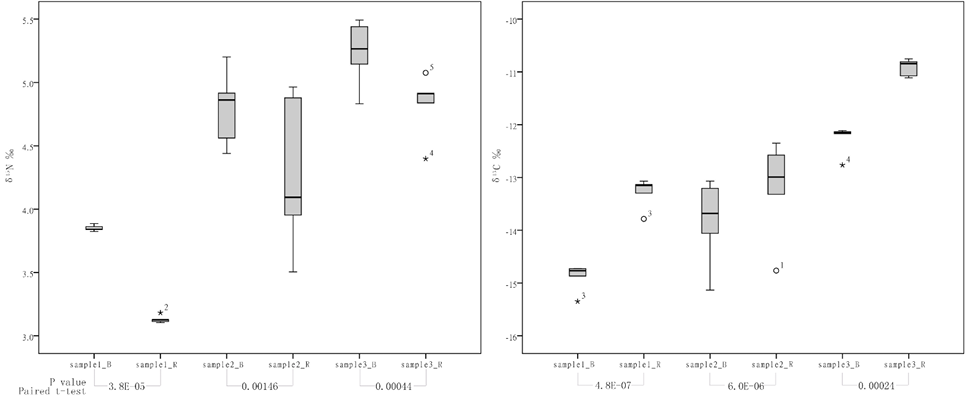
Fig. 1.
Values of δ13C and δ15N in different parts of the feathers from the pigeons.
Note that the horizontal coordinates are feather samples. For example, sample1_B indicates the barbules of the feathers from sample1, and sample1_R indicates the rachis of the feathers from sample1.
