
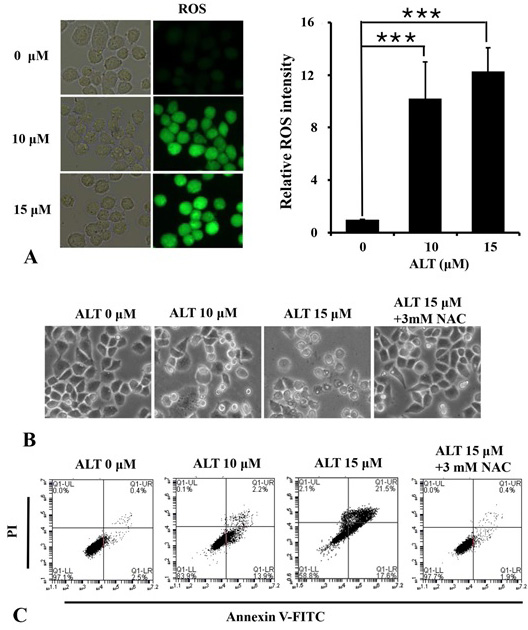
Fig. 6.
ALT induces apoptosis via ROS generation. (A) A2780 cells were stained with DCFHDA for 40 min following 6 h drug treatment as shown in figure. DCF fluorescence was checked using Leica DMi8 fluorescence microscope and images were captured. ROS intensity was analyzed using ImageJ (NIH) software. (B and C) A2780 cells were treated with ALT either pre-treated with NAC or un-treated with NAC and cell morphological changes (B) and apoptosis rates (C) were measured.