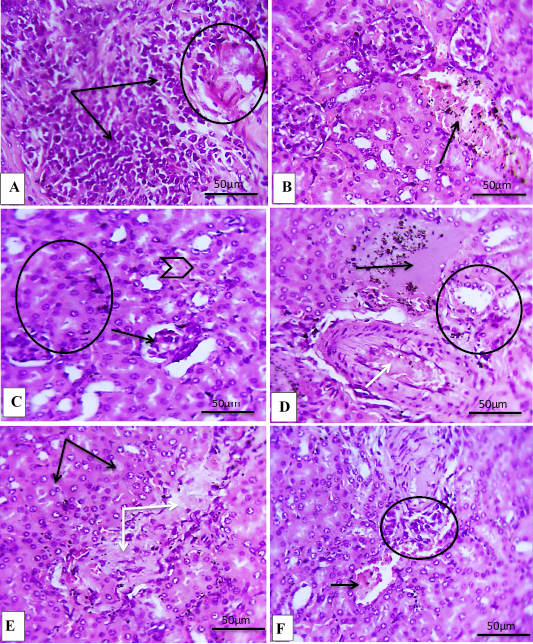
Figure 3:
Paraffin sections of experiment groups kidney, (A, B and C) H group kidney note: showing (A 400X) severe inflammation infiltration (black arrow), and severe necrosis (circle), while (B 400X) hemorrhage (black arrow), (C 400X) necrosis of renal glomerulus (black arrow), degeneration of renal tubular cells (arrow head), and hypertrophy of renal epithelial (circle), while (D 400X) artery congestion (white arrow), Accumulation of edema fluid (black arrow), and acute degeneration of renal tubules cells (circle). L group notes (E 400X) necrosis of renal tubules cells (white arrow), and degeneration (black arrow), while (F 400X), note mild inflammation infiltration (circle) and hemorrhage (black arrow). (H and E staining).