
Figure 4:
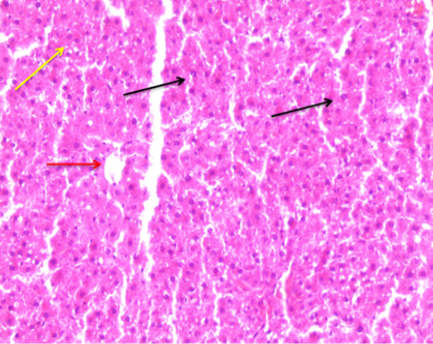
Photomicrograph of AZA + Aloe group rats liver tissue slice showing modest hepatic edema (black arrow), hepatic inflammatory cell infiltration (yellow arrow), and normal central vein (red arrow). 40X (H and E).
Photomicrograph of AZA + Aloe group rats liver tissue slice showing modest hepatic edema (black arrow), hepatic inflammatory cell infiltration (yellow arrow), and normal central vein (red arrow). 40X (H and E).