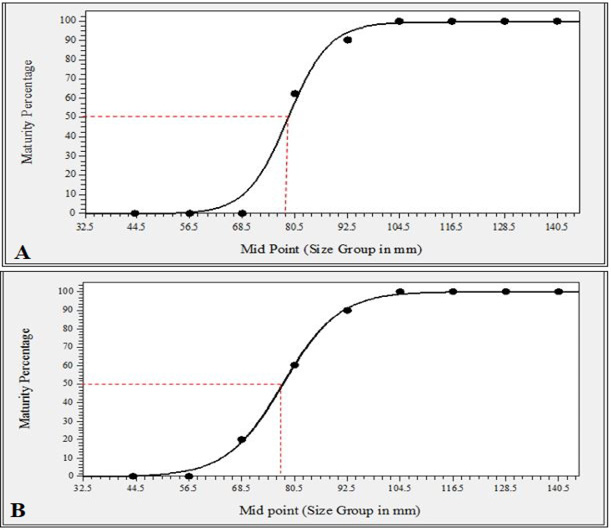
Fig. 5.
The logistic curves of 50 % maturity in various size classes of the male (A) and female (B) Portunus segnis (N = 110).
Logistic model: y = a / (1+b × exp (-cx))
Coefficient data: Male; a= 9.95274370365E+001; b= 1.95578686191E+007; c= 2.12857746078E-001; Standard error: 4.7234002; Correlation Coefficient: 0.9962958.
Female; a = 1.00217211735E + 002; b= 2.01356887217E + 005; c= 1.56928940609E-001; Standard error: 1.6418724; Correlation coefficient: 0.9994943.