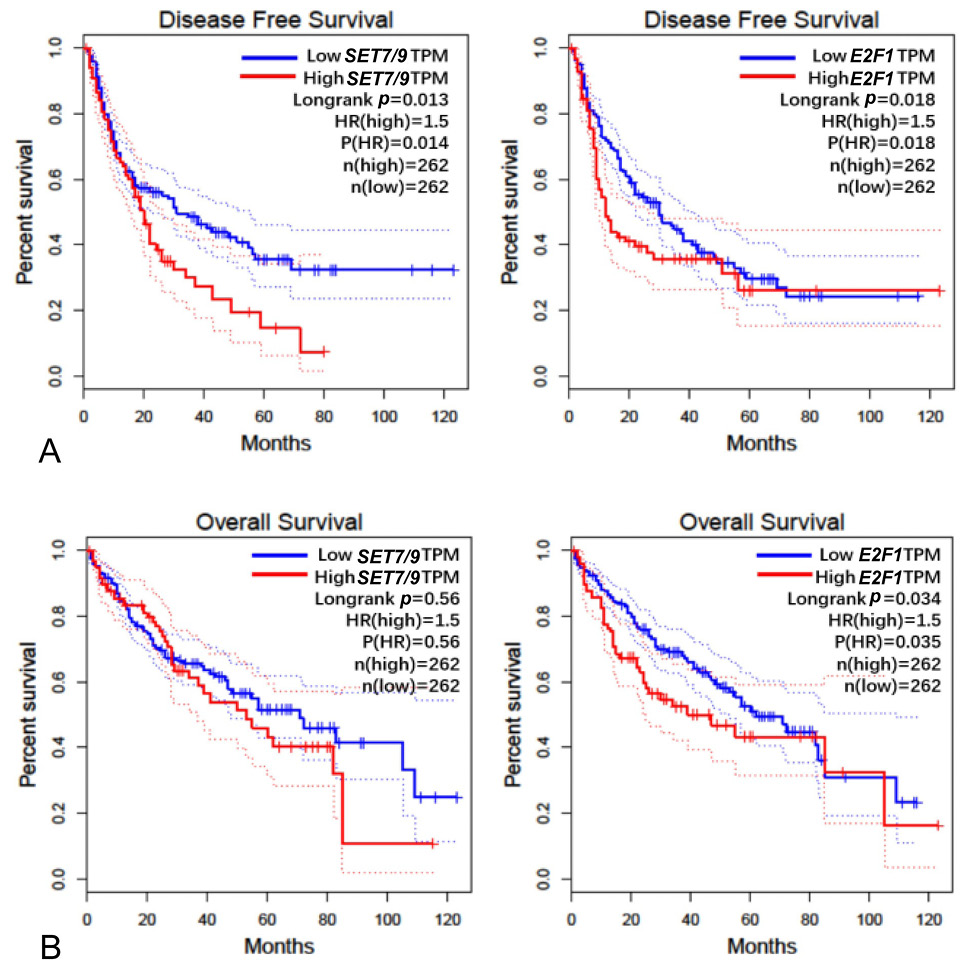
Fig. 2.
The disease-free survival curve (A) and overall survival curve (B) of SET7/9 and E2F1 in HCC. The number of samples from high-expression group and low-expression group and the relevant p values were indicated on the right corner of each panel.