View larger version:
Download Original File
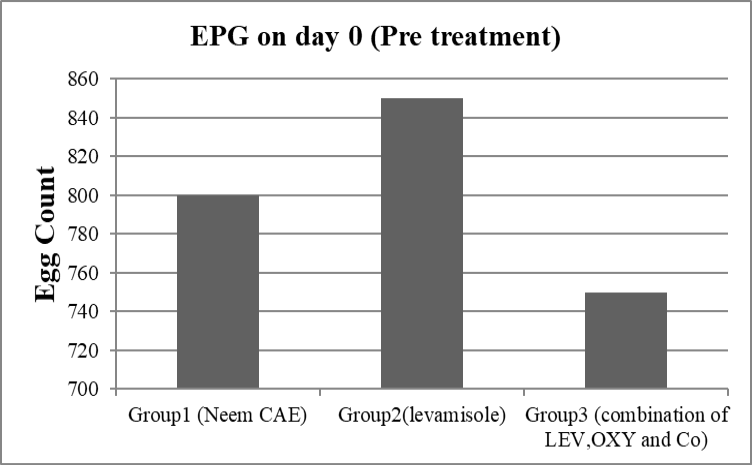
Figure 3:
Graph showing faecal egg count of infected groups at day 0 pre treatment.
