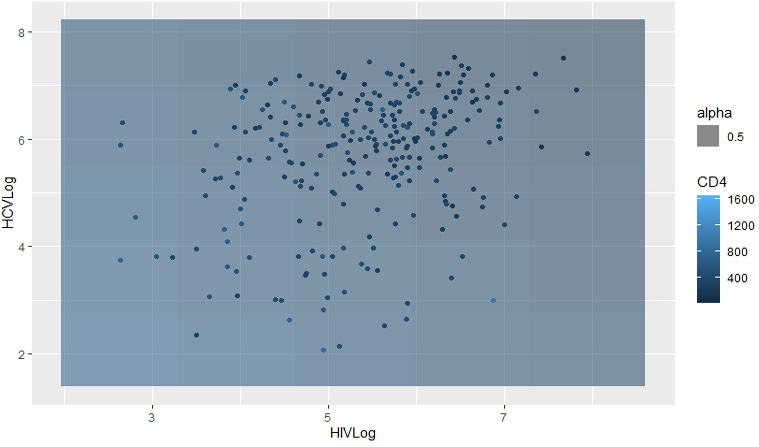
Fig. 1.
Scatter plot for correlation between CD4 and viral load of HIV and HCV monoinfected patients. The numeric representation of (intercept) HIV_viral_Load and HCV_viral_Load is 3.898e+02-1.680e-06 -2.534e-06. The regression line is a straight line demonstrating the best fit for measurement points on scatter plot. p-value is obtained by Pearson correlation tests.