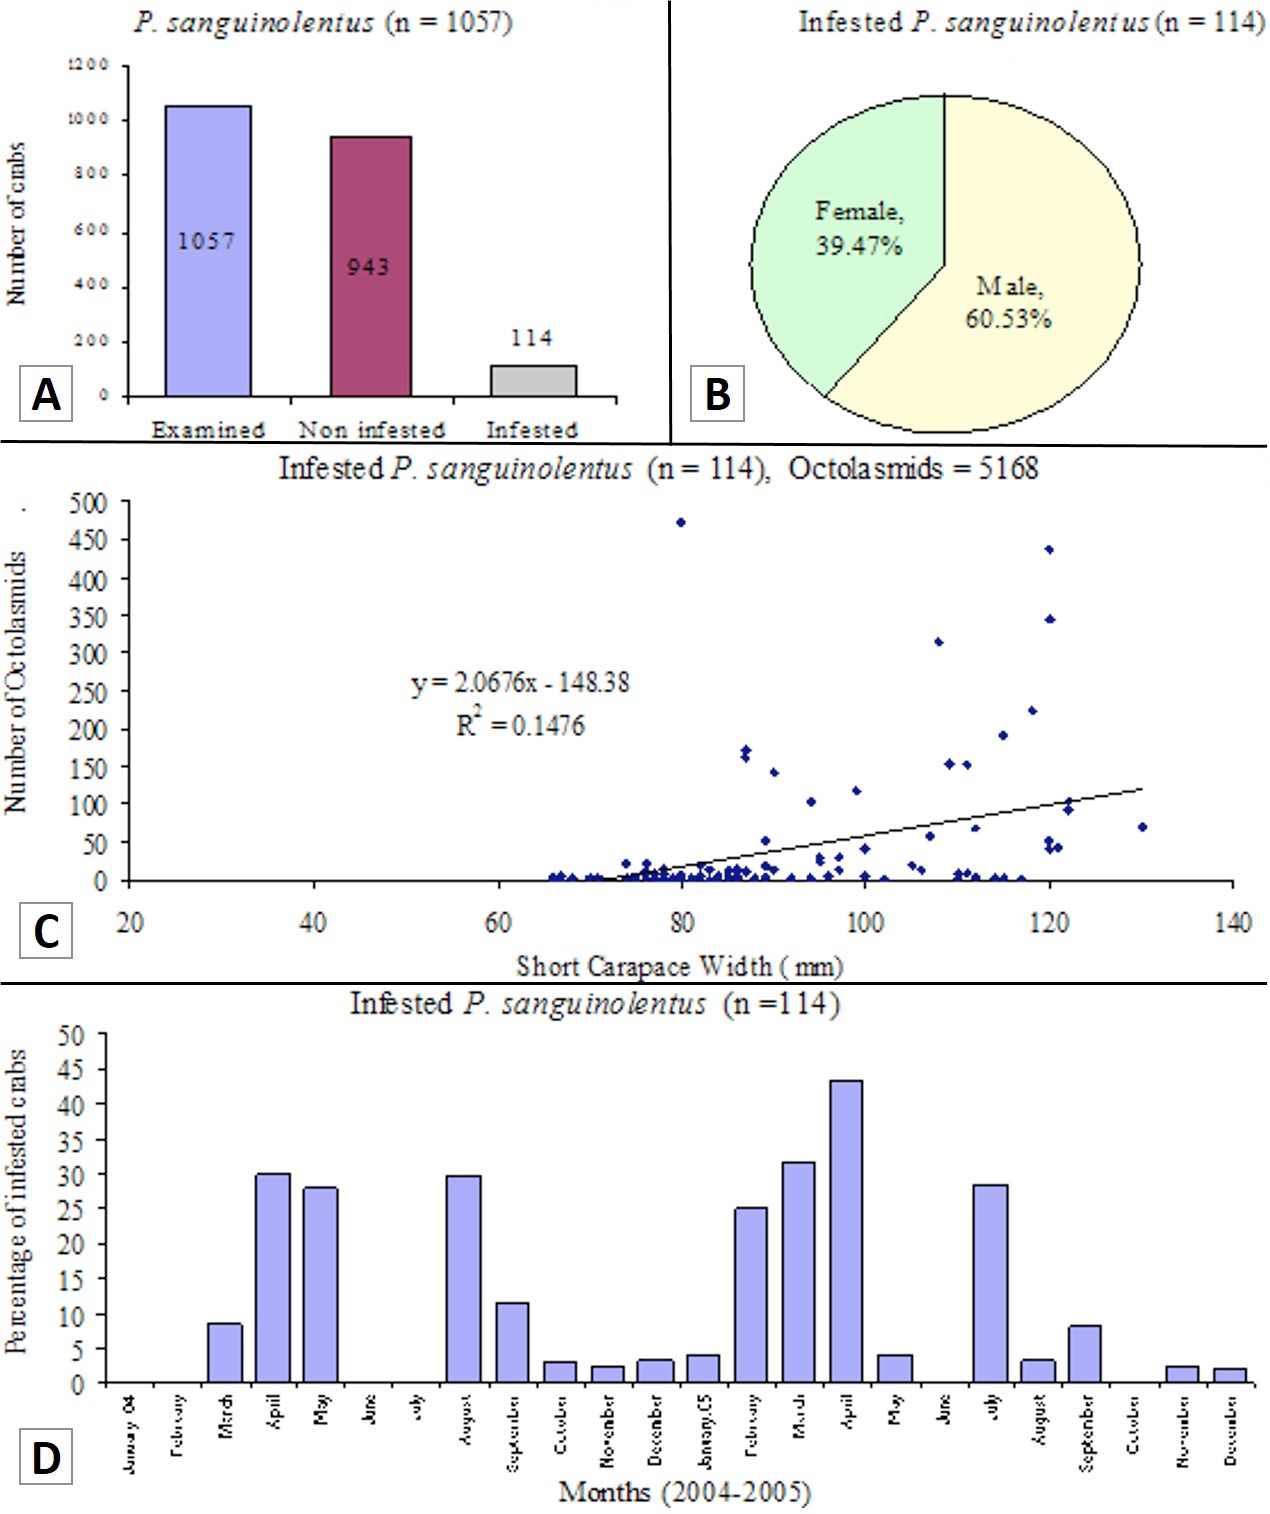
Fig 4
Portunus sanguinolentus. (A) Bar- diagram showing number of infested and non- infested crabs. (B) Pi-diagram showing percentage of infested male and female crabs. (C) Relationship between number of the octolasmids and the size of the crab. (D) Bar-diagram showing seasonal abundance of the infested crabs.
