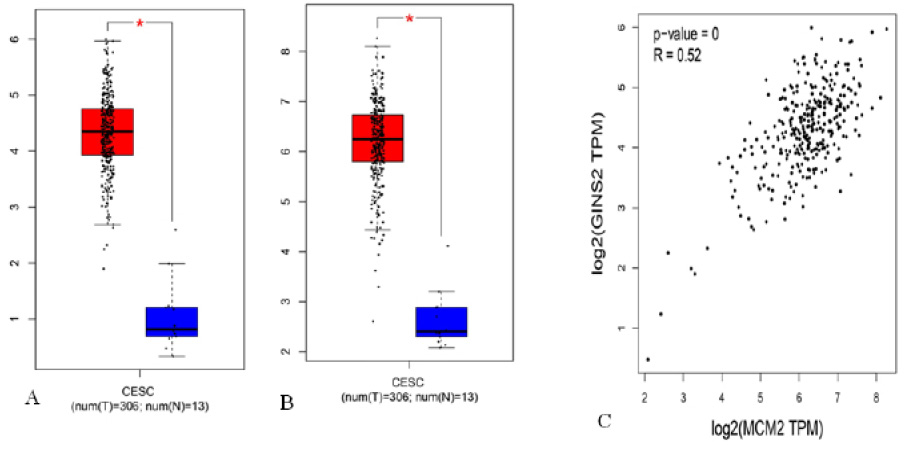
Fig. 4.
Expression levels and Pearson correlation analyses between GINS2 and MCM2. Both GINS2 (A) and MCM2 (B) presented high expression levels in CC tissues, but exhibited low expression levels in normal cervical tissues. (C) GINS2 was positively correlated with MCM2.