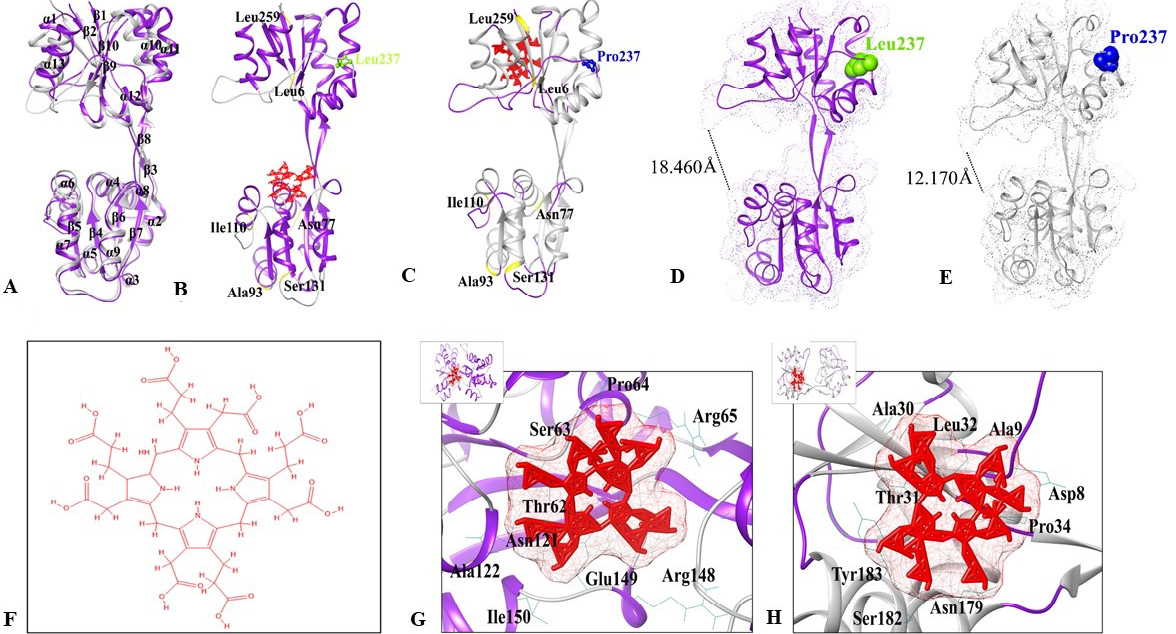
Structure analysis of UROSWT and UROSL237P. (A) Superimposition of UROSWT and UROSL237P structures. UROSWT is indicated in purple color, while UROSL237P is indicated in grey color. (B) Topview representation of UROSWT-Urogen complex in purple color. (C) UROSL237P -Urogen complex in grey color. Urogen is shown in red colored stick representation. Leu237 and Pro237 residues are indicated by green and blue spheres. (D-E) Structural comparison. (D) UROSWT is indicated in purple color, (E) UROSL237P model is indicated in grey color. Leu237 and Pro237 residues are indicated by green and blue spheres. Dotted lines indicate distance between adjacent residues. Bond length is indicated in Å. (F) Binding mode analysis of UROSWT and UROSL237P. (G) 2D structure of Urogen (3-[7, 12, 18-tris (2-carboxyethyl)-3, 8, 13, 17 tetrakis (carboxymeth-yl)-5, 10, 15, 20, 21, 22, 23, 24 octahydroporphyrin-2-yl] propanoicacid). (H) UROSWT (purple) binding with Urogen (red). (C) UROSL237P (grey) binding with Urogen (red). The interacting residues are labelled in black color with wire representation.