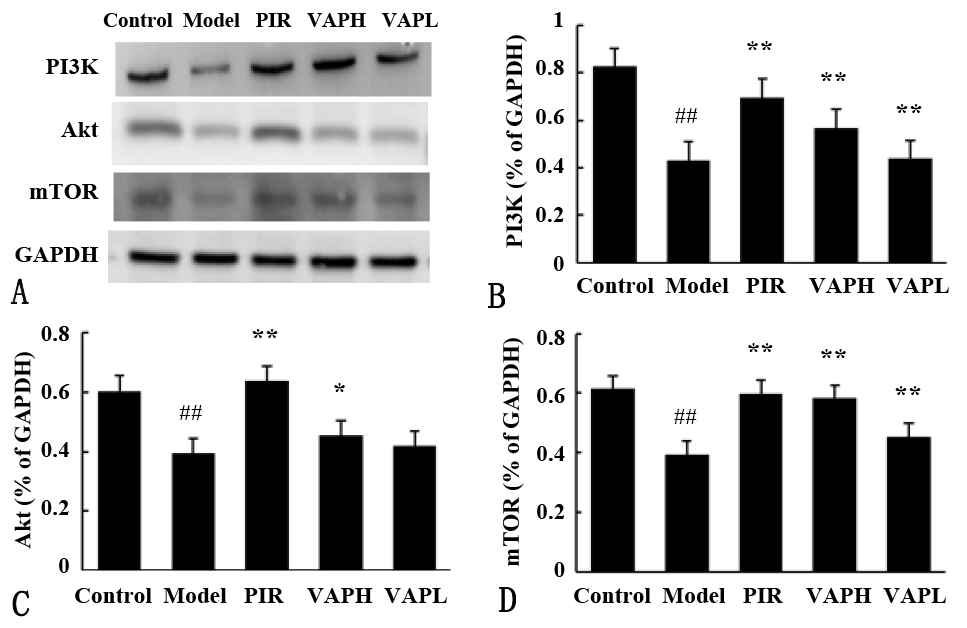
Fig. 4.
Expression levels of PI3K, Akt and mTOR proteins in the hippocampus tissue of rats in each group.
Notes: (A) Western blot analysis; (B–D) Quantification of PI3K, Akt and mTOR in five groups. Data are presented as mean ± SD (n = 10 per group). Compared with Control group, ## P <0.01; Compared with Model group, * P <0.05, ** P <0.01.