View larger version:
Download Original File
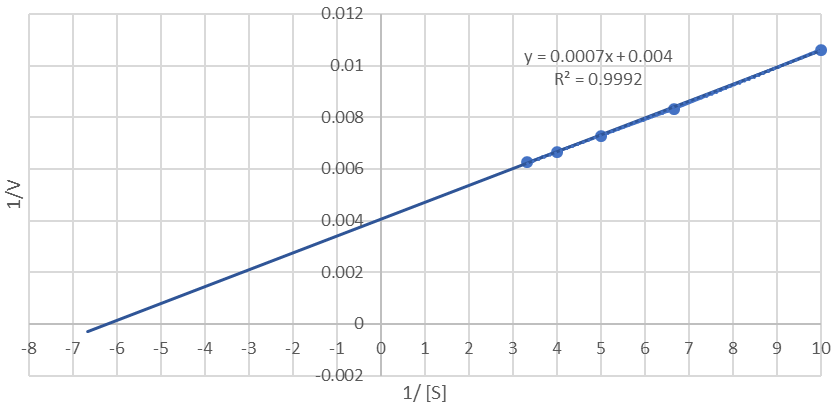
Fig. 4.
Lineweaver Burk plot drawn to calculate Vmax and Km values.