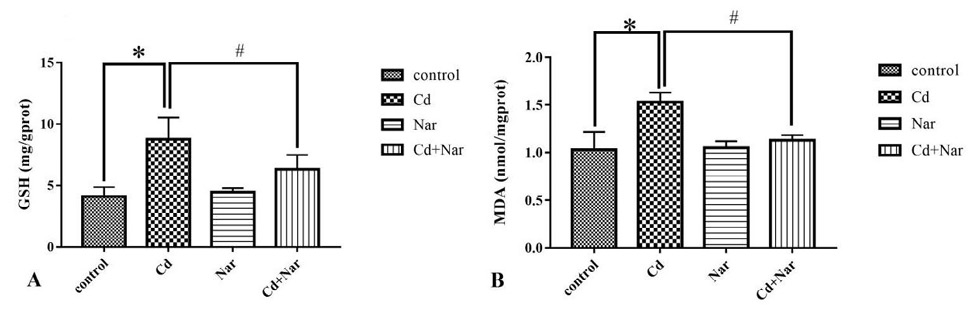
Fig. 1.
GSH and MDA levels assay in kidney tissues.
Rats were treated with CdCl2 and/or Nar for 4 weeks. Then, the kidney tissues were used to determine the levels of GSH (A) and MDA (B). All measurement results were expressed as mean ± standard deviation. *, indicates significant difference compared with the corresponding control (*P < 0.05). #, indicates statistically significant difference between the Cd and Cd + Nar groups (#P < 0.05).