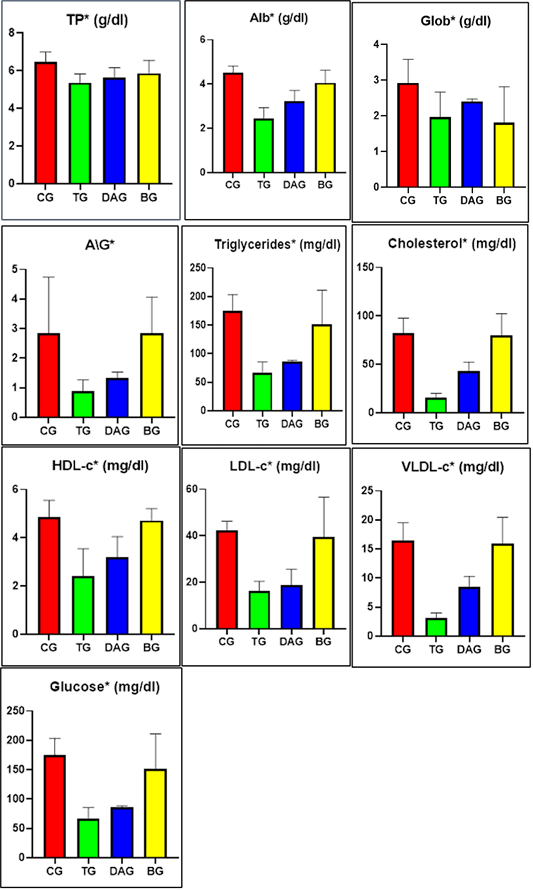
Figure 2:
Comparison of glucose, protein, and lipid profiles between the studied groups, differences between groups were considered significant when P ˂ 0.05, and indicated by (*).
Comparison of glucose, protein, and lipid profiles between the studied groups, differences between groups were considered significant when P ˂ 0.05, and indicated by (*).